Connect Baserow to Power BI - REST API Integration Guide
Power BI never receives data from Baserow automatically - it reaches out itself, through the built-in Web connector, authenticates with a Baserow database token, and turns table rows into interactive reports; this guide covers the pull architecture, a step-by-step setup from token to first visual, pagination handling with M code, and a field-type mapping table.
When to Use This Integration
- Leadership reporting. A team runs projects in Baserow, but leadership wants a real-time visual overview of status and resource allocation.
- Multi-source analysis. Data is split across Baserow, Excel, and SQL Server - Power BI merges all three sources into one report.
- Automated recurring reports. Instead of exporting a Baserow CSV by hand every week, an API connection with a refresh schedule removes the manual step.
- Client-facing reports. Finished Power BI visuals get embedded on a website or sent out as a PDF without opening access to the underlying database.
- Compliance tracking. Compliance data tracked in Baserow becomes a standardized, timestamped report.
- Inventory monitoring. Stock levels stored in Baserow are visualized with automatic alerts when supplies run low.
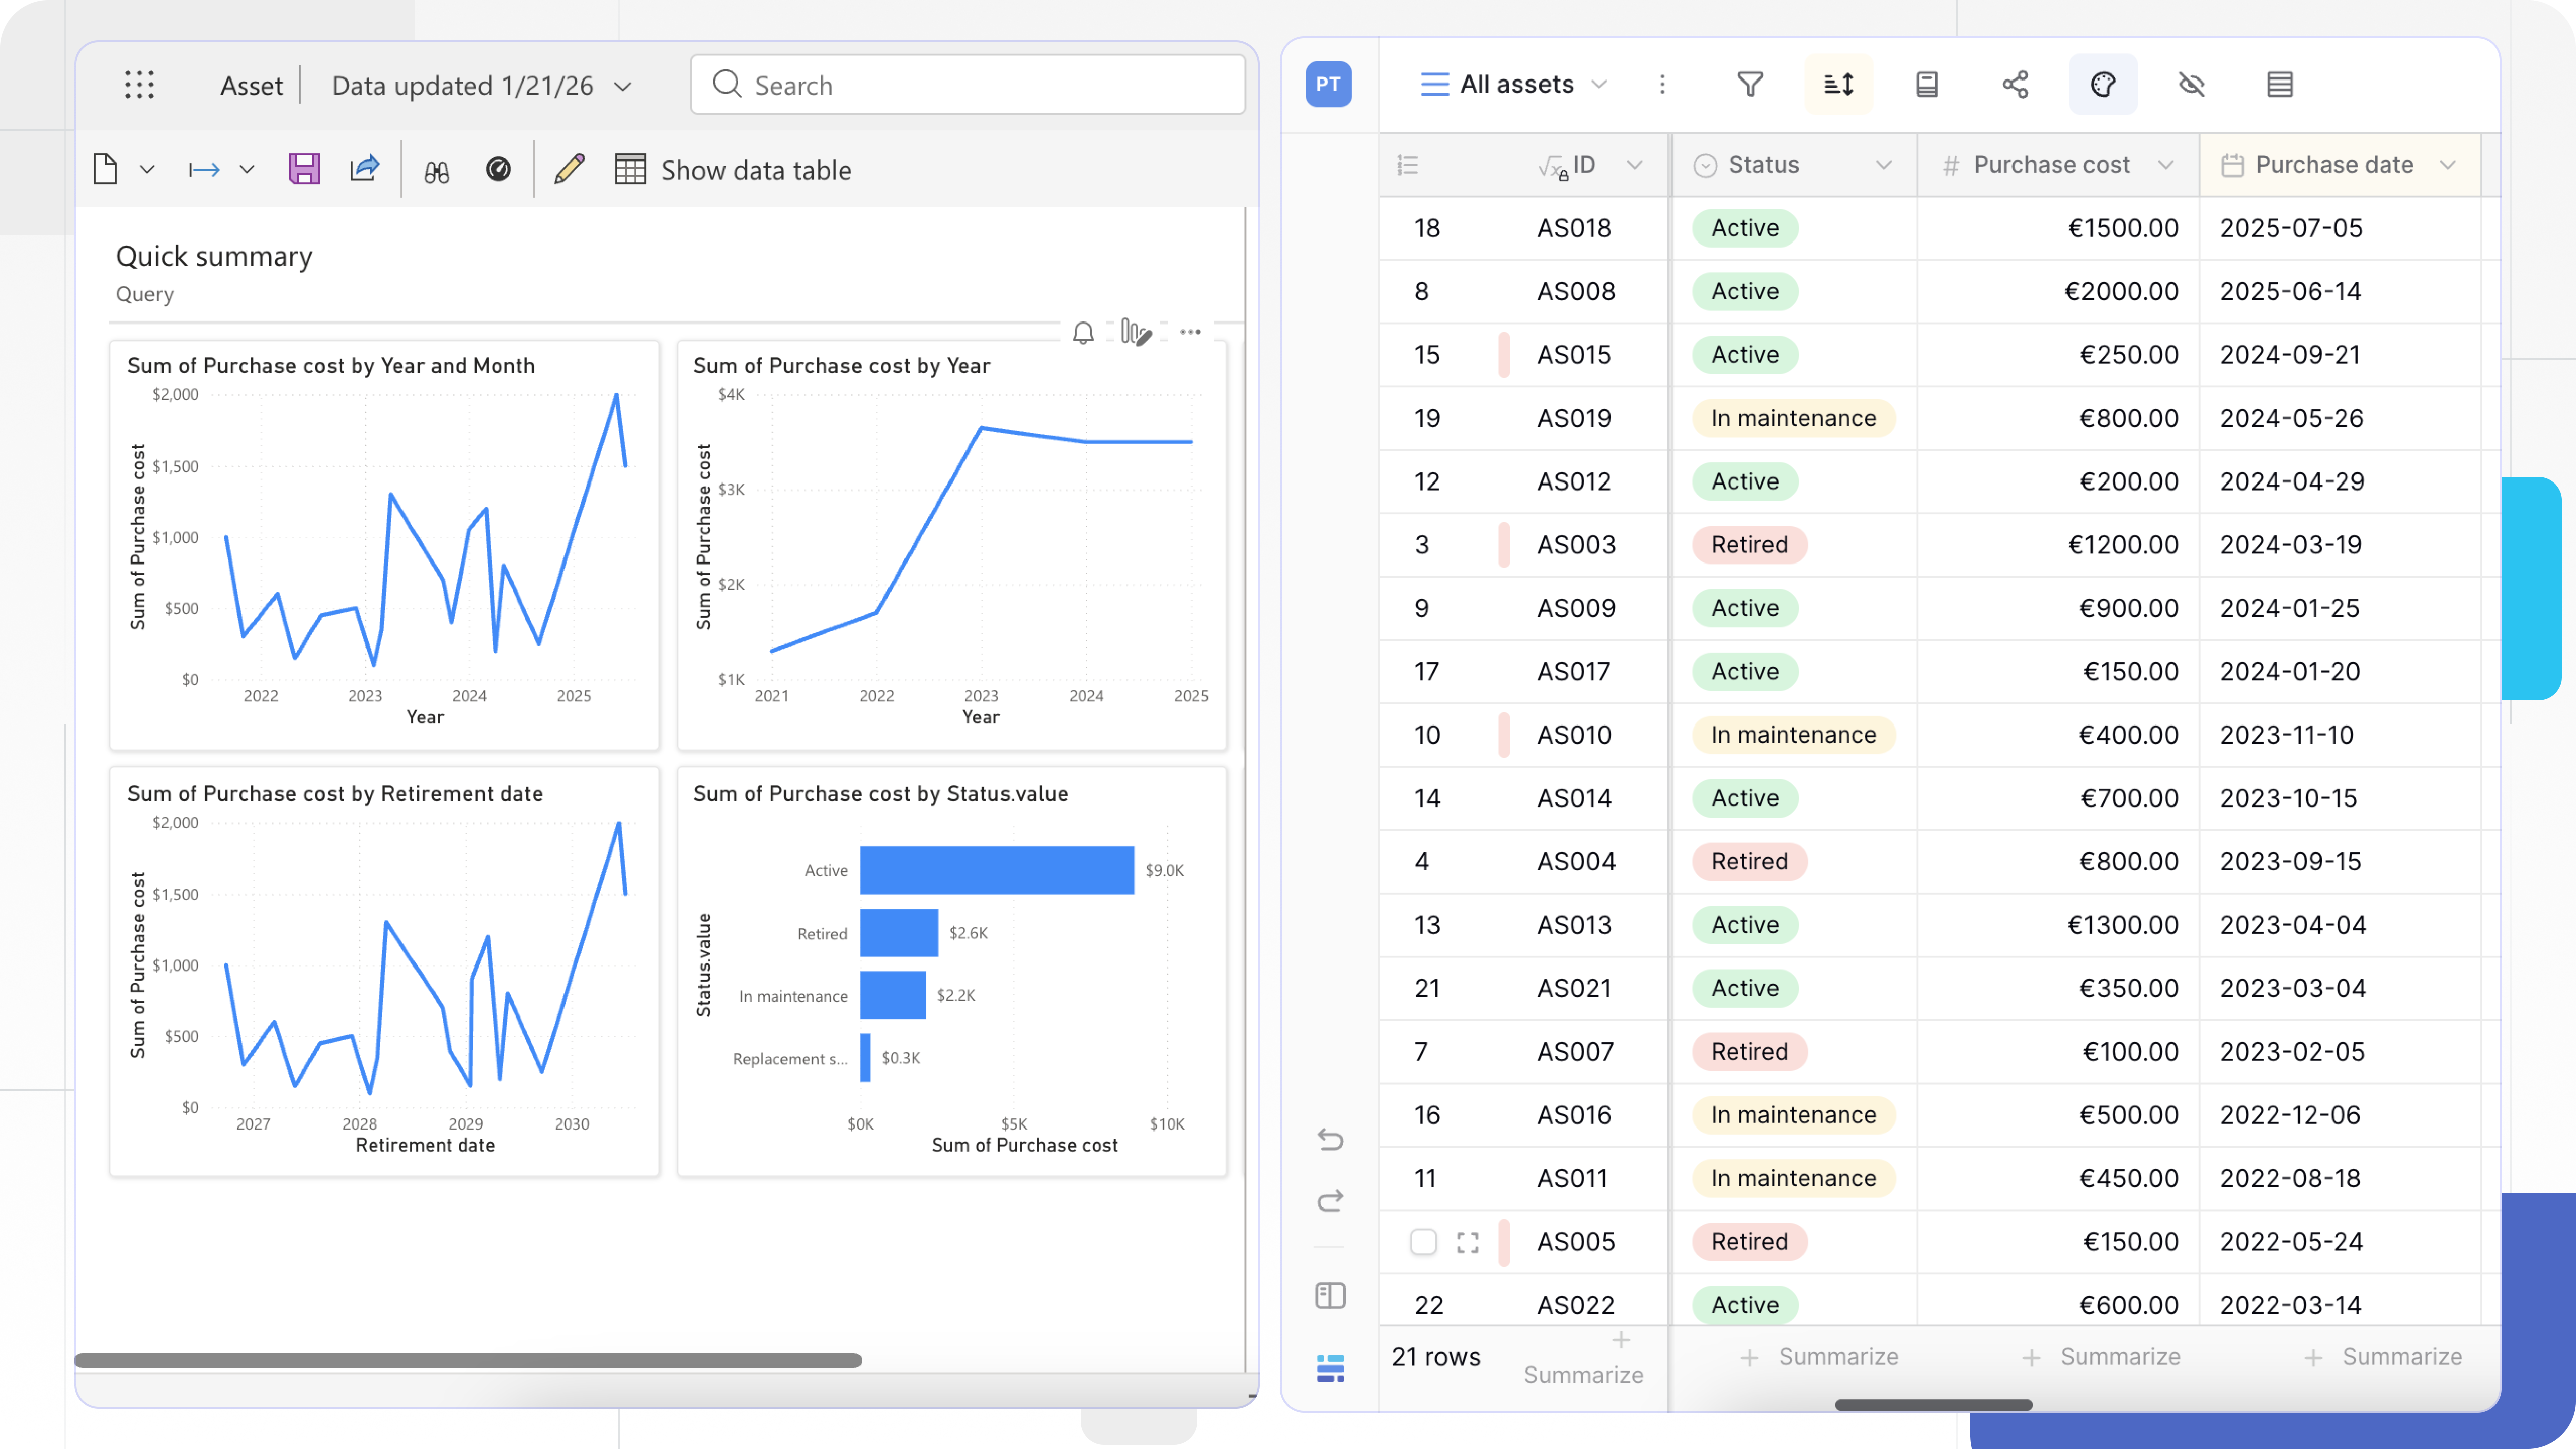
Integration Architecture
Data only flows one direction: Baserow does not push data to Power BI, Power BI pulls it. Which data comes through, and how much, is controlled entirely by the URL parameters on the Power BI side.
Baserow database (the data source)
    ↓
REST API endpoint (returns JSON)
    ↓
Power BI Web connector (fetches the data)
    ↓
Power Query Editor (turns JSON into tables)
    ↓
Power BI data model (ready to visualize)
Prerequisites
- A Baserow account (cloud or self-hosted) with access to the workspace holding the target database.
- Power BI Desktop , latest version recommended.
- Basic familiarity with database structure: tables, rows, fields, relationships.
- A Baserow database token to authenticate requests.
Step 1: Generate a Database Token
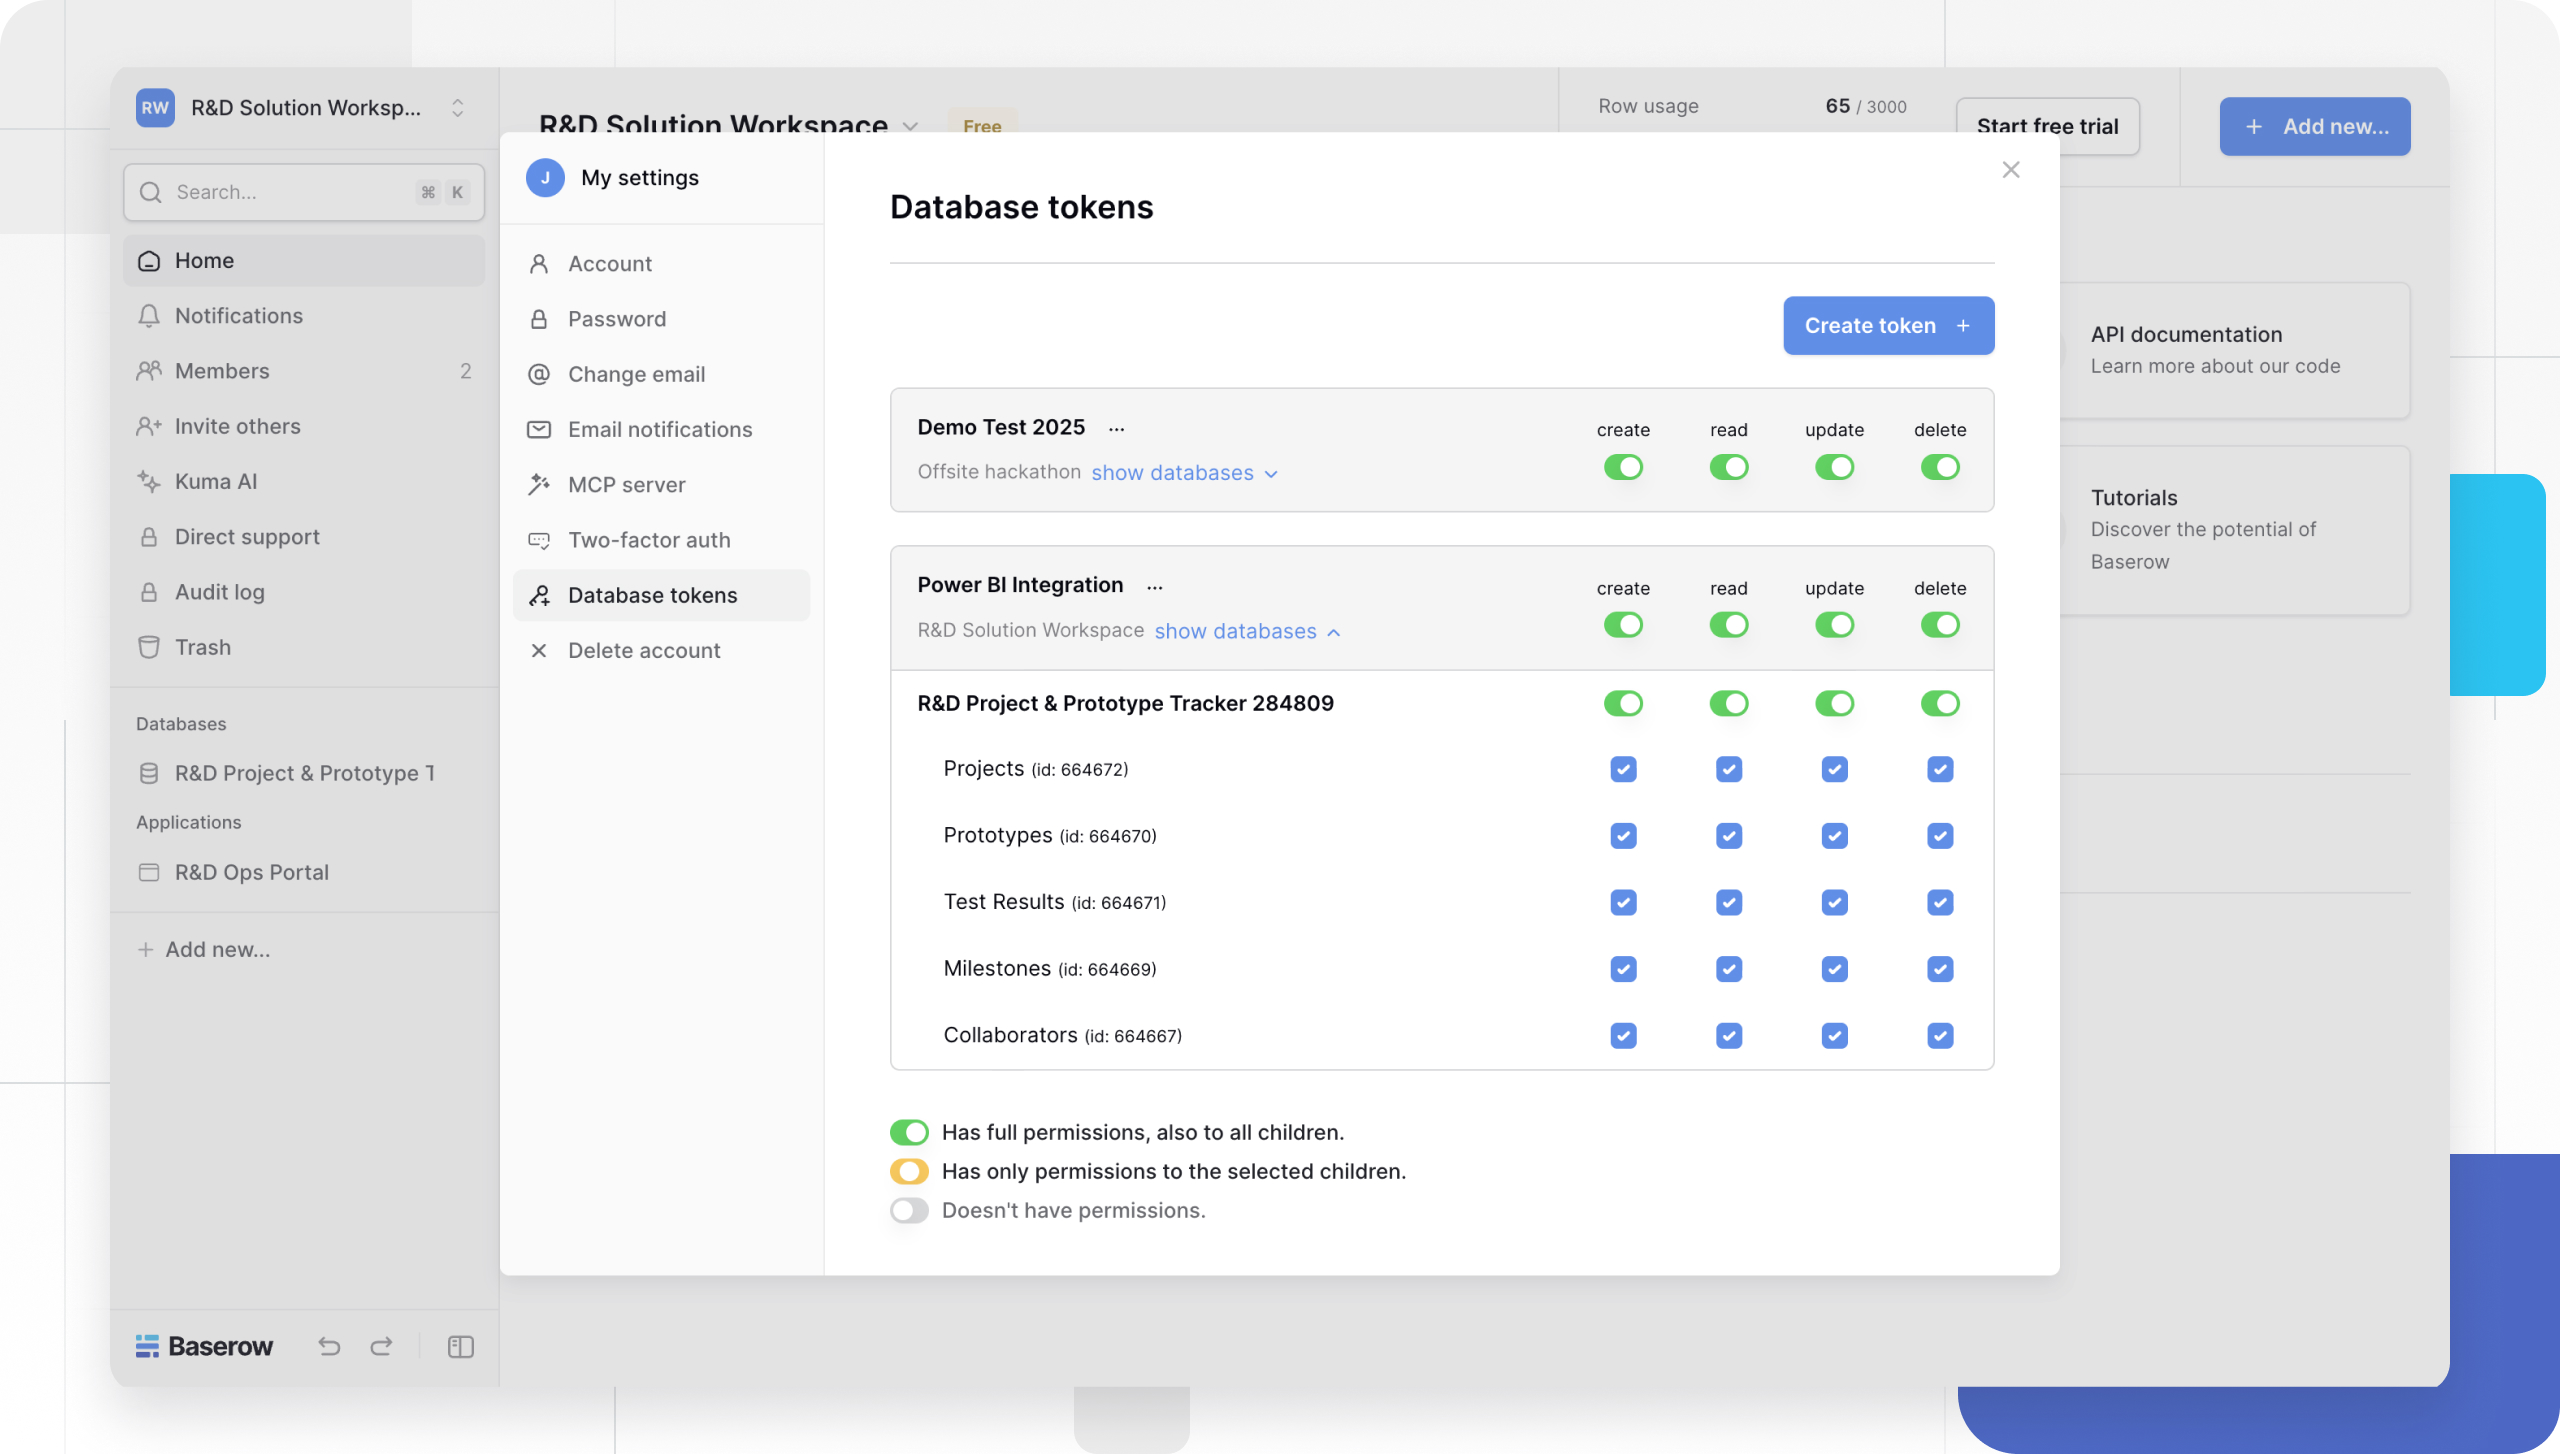
A database token proves the right to access specific Baserow tables - without it, Power BI’s Web connector cannot read a single row.
- Log in to Baserow and open the profile menu in the top-right corner.
- Go to Settings → Database tokens.
- Click + Create token.
- Pick the workspace and give the token a descriptive name, e.g.
Power BI Integration. - Scope the token to only the tables that need to be visualized.
- Set permissions: reading rows is required, creating and updating are optional unless Power BI needs to write data back.
- Copy the token string once it appears - it is shown only that one time.
See Baserow Database Tokens for the difference between a database token and a JWT token. A token grants access to row data - keep it as secret as a password and never commit it to a public repository.
Step 2: Build the Endpoint URL
Power BI lists rows by making a GET request to the table endpoint. The base format is:
https://api.baserow.io/api/database/rows/table/[TABLE_ID]/See Baserow Database API for how this address is put together. The table ID shows up directly in the browser’s URL bar while the table is open, or can be located through the other methods covered in Finding a Baserow Database and Table ID .
Two query parameters shape the response:
user_field_names=true- returns readable field names instead offield_124.size=200- the maximum number of rows per page (the default is 100).
The finished URL looks like this:
https://api.baserow.io/api/database/rows/table/4567/?user_field_names=true&size=200Step 3: Connect Through Power BI’s Web Connector
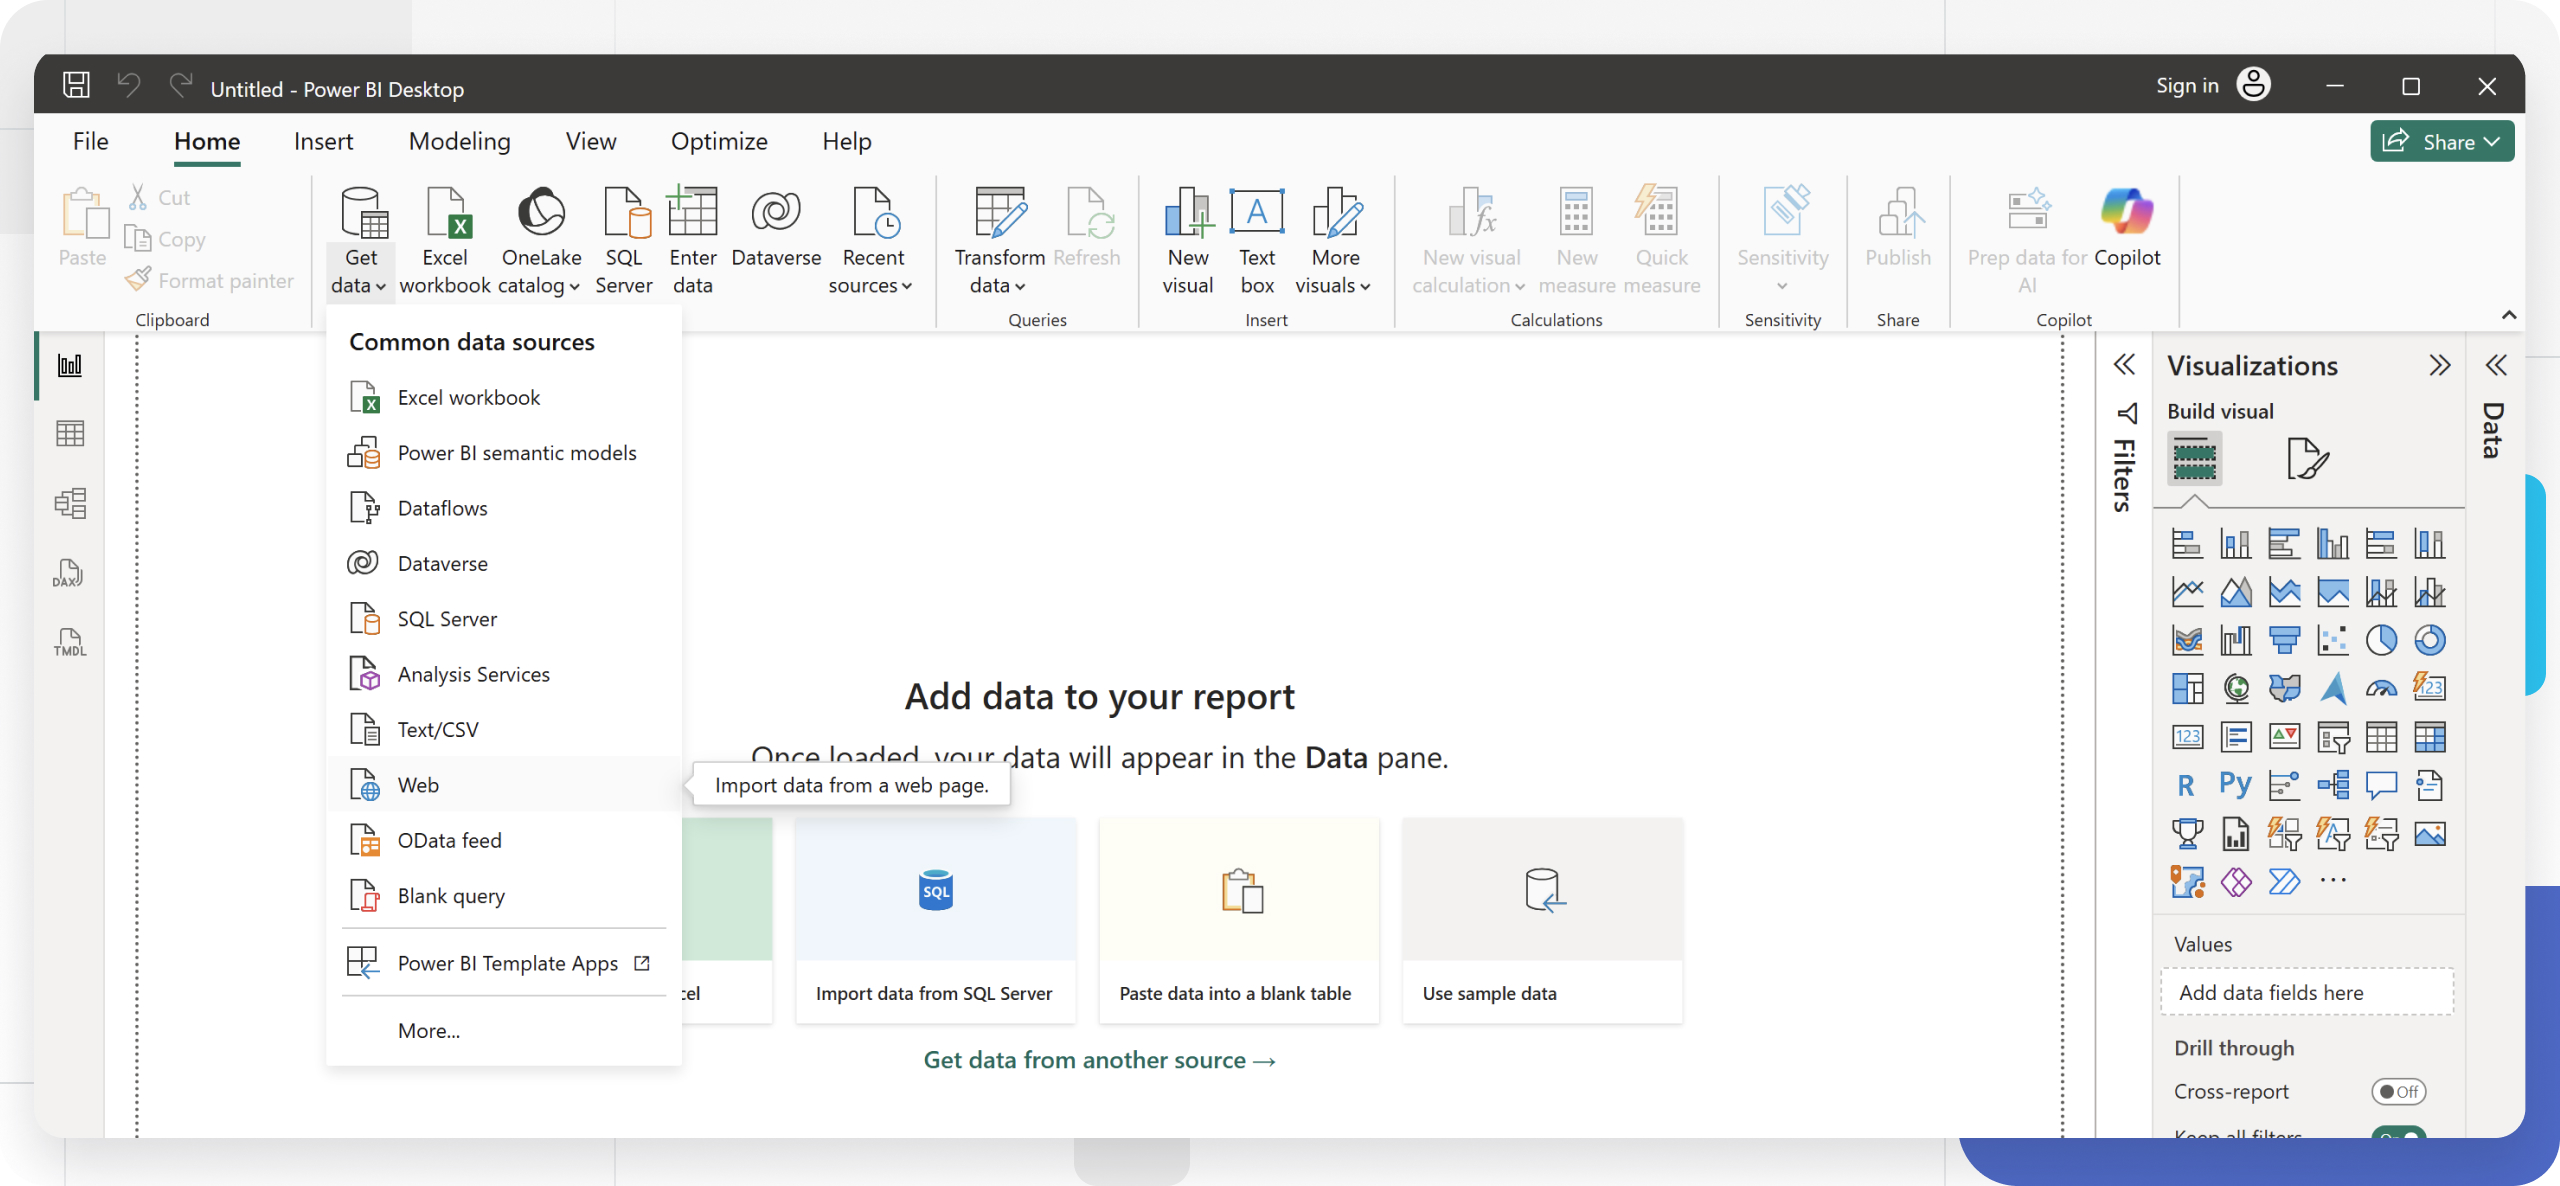
- Open Power BI Desktop and start a blank report or open an existing one.
- On the Home tab, click Get data and choose the Web connector.
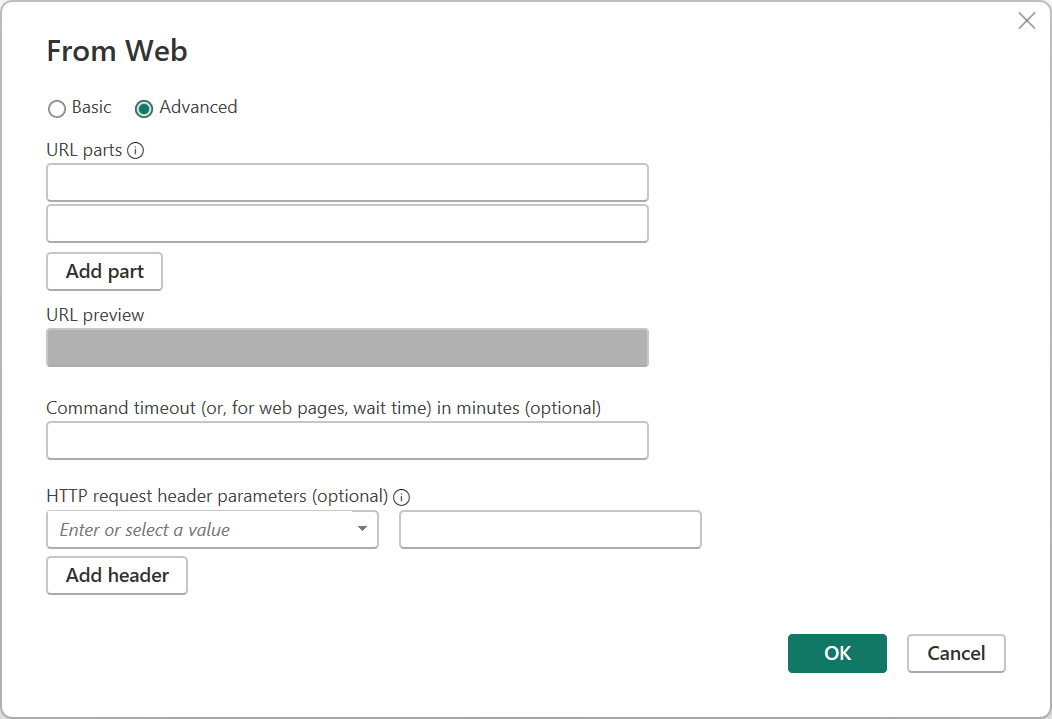
- In the dialog, switch to Advanced mode.
- Paste the table endpoint URL into the URL field.
- In the HTTP header section, add an Authorization header set to
Token [YOUR_DATABASE_TOKEN]- the word “Token” plus a space before the token itself is required. - Click OK.
If authentication succeeds, the Power Query Editor opens with a preview of the data. Power BI remembers the credentials afterward - to edit them later, go to Home → Transform Data → Data source settings.
Step 4: Clean the Data and Set Types
Baserow’s JSON response does not arrive as a ready-made table in Power Query - it needs a few cleanup steps:
- Remove the housekeeping columns
count,next, andprevious- they hold pagination metadata, not row data. - Rename any columns that still carry the
results.prefix (e.g.results.id) into readable names. - Filter rows as needed using the filter dropdown on a column header.
- Check each column’s data type on the Transform tab - dates and numbers are the most common misdetections.
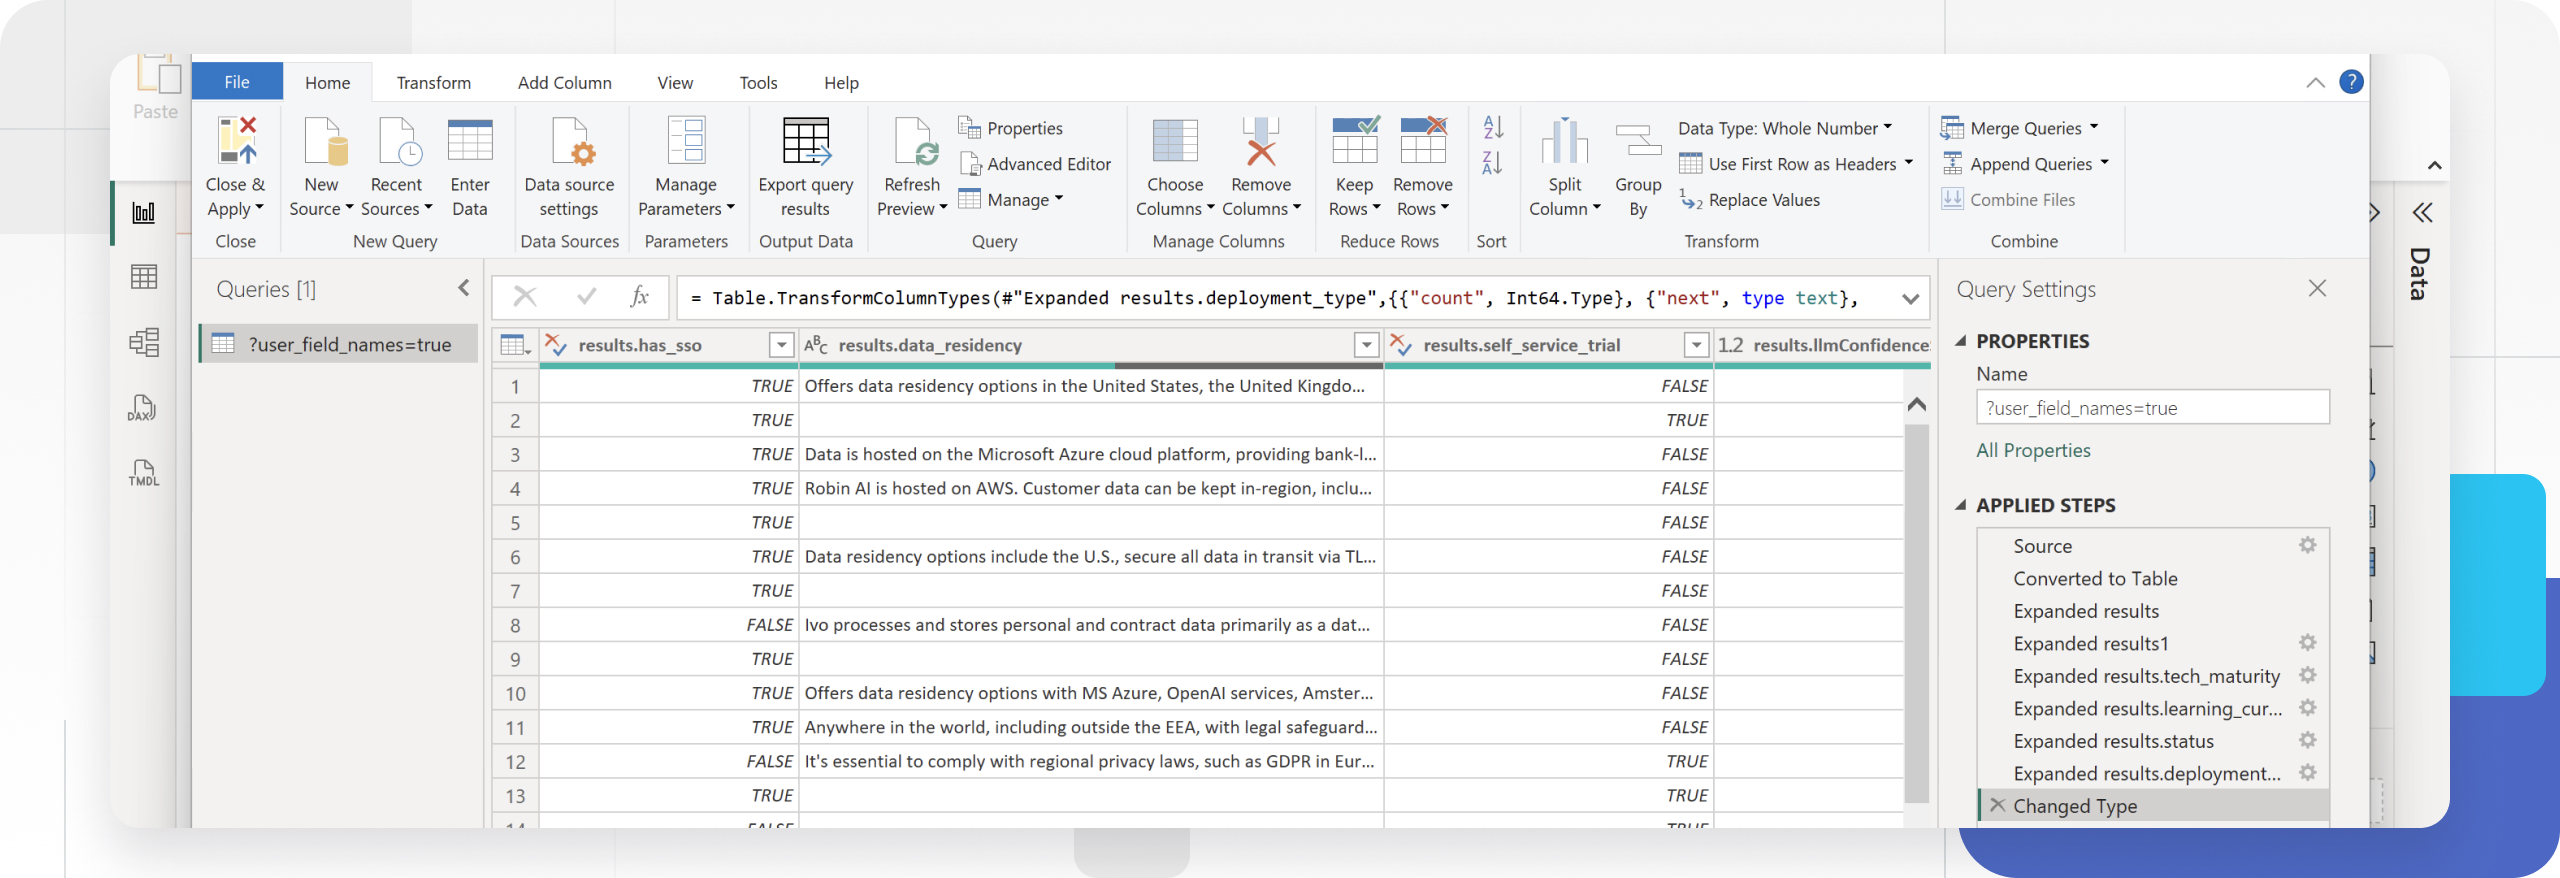
A few field types need special handling because they arrive as nested structures:
- Single select - expand the column to get the
value. - Multiple select - Power Query returns a nested list; expand it to new rows first, then expand again to reach
value. Power BI creates one new row per list item, duplicating the rest of the original record’s data. - File fields - return an array of file objects. To pull just the first file’s URL, add a custom column with this M formula:
Table.AddColumn(Source, "File_URL", each try [file_field]{0}[url] otherwise null).
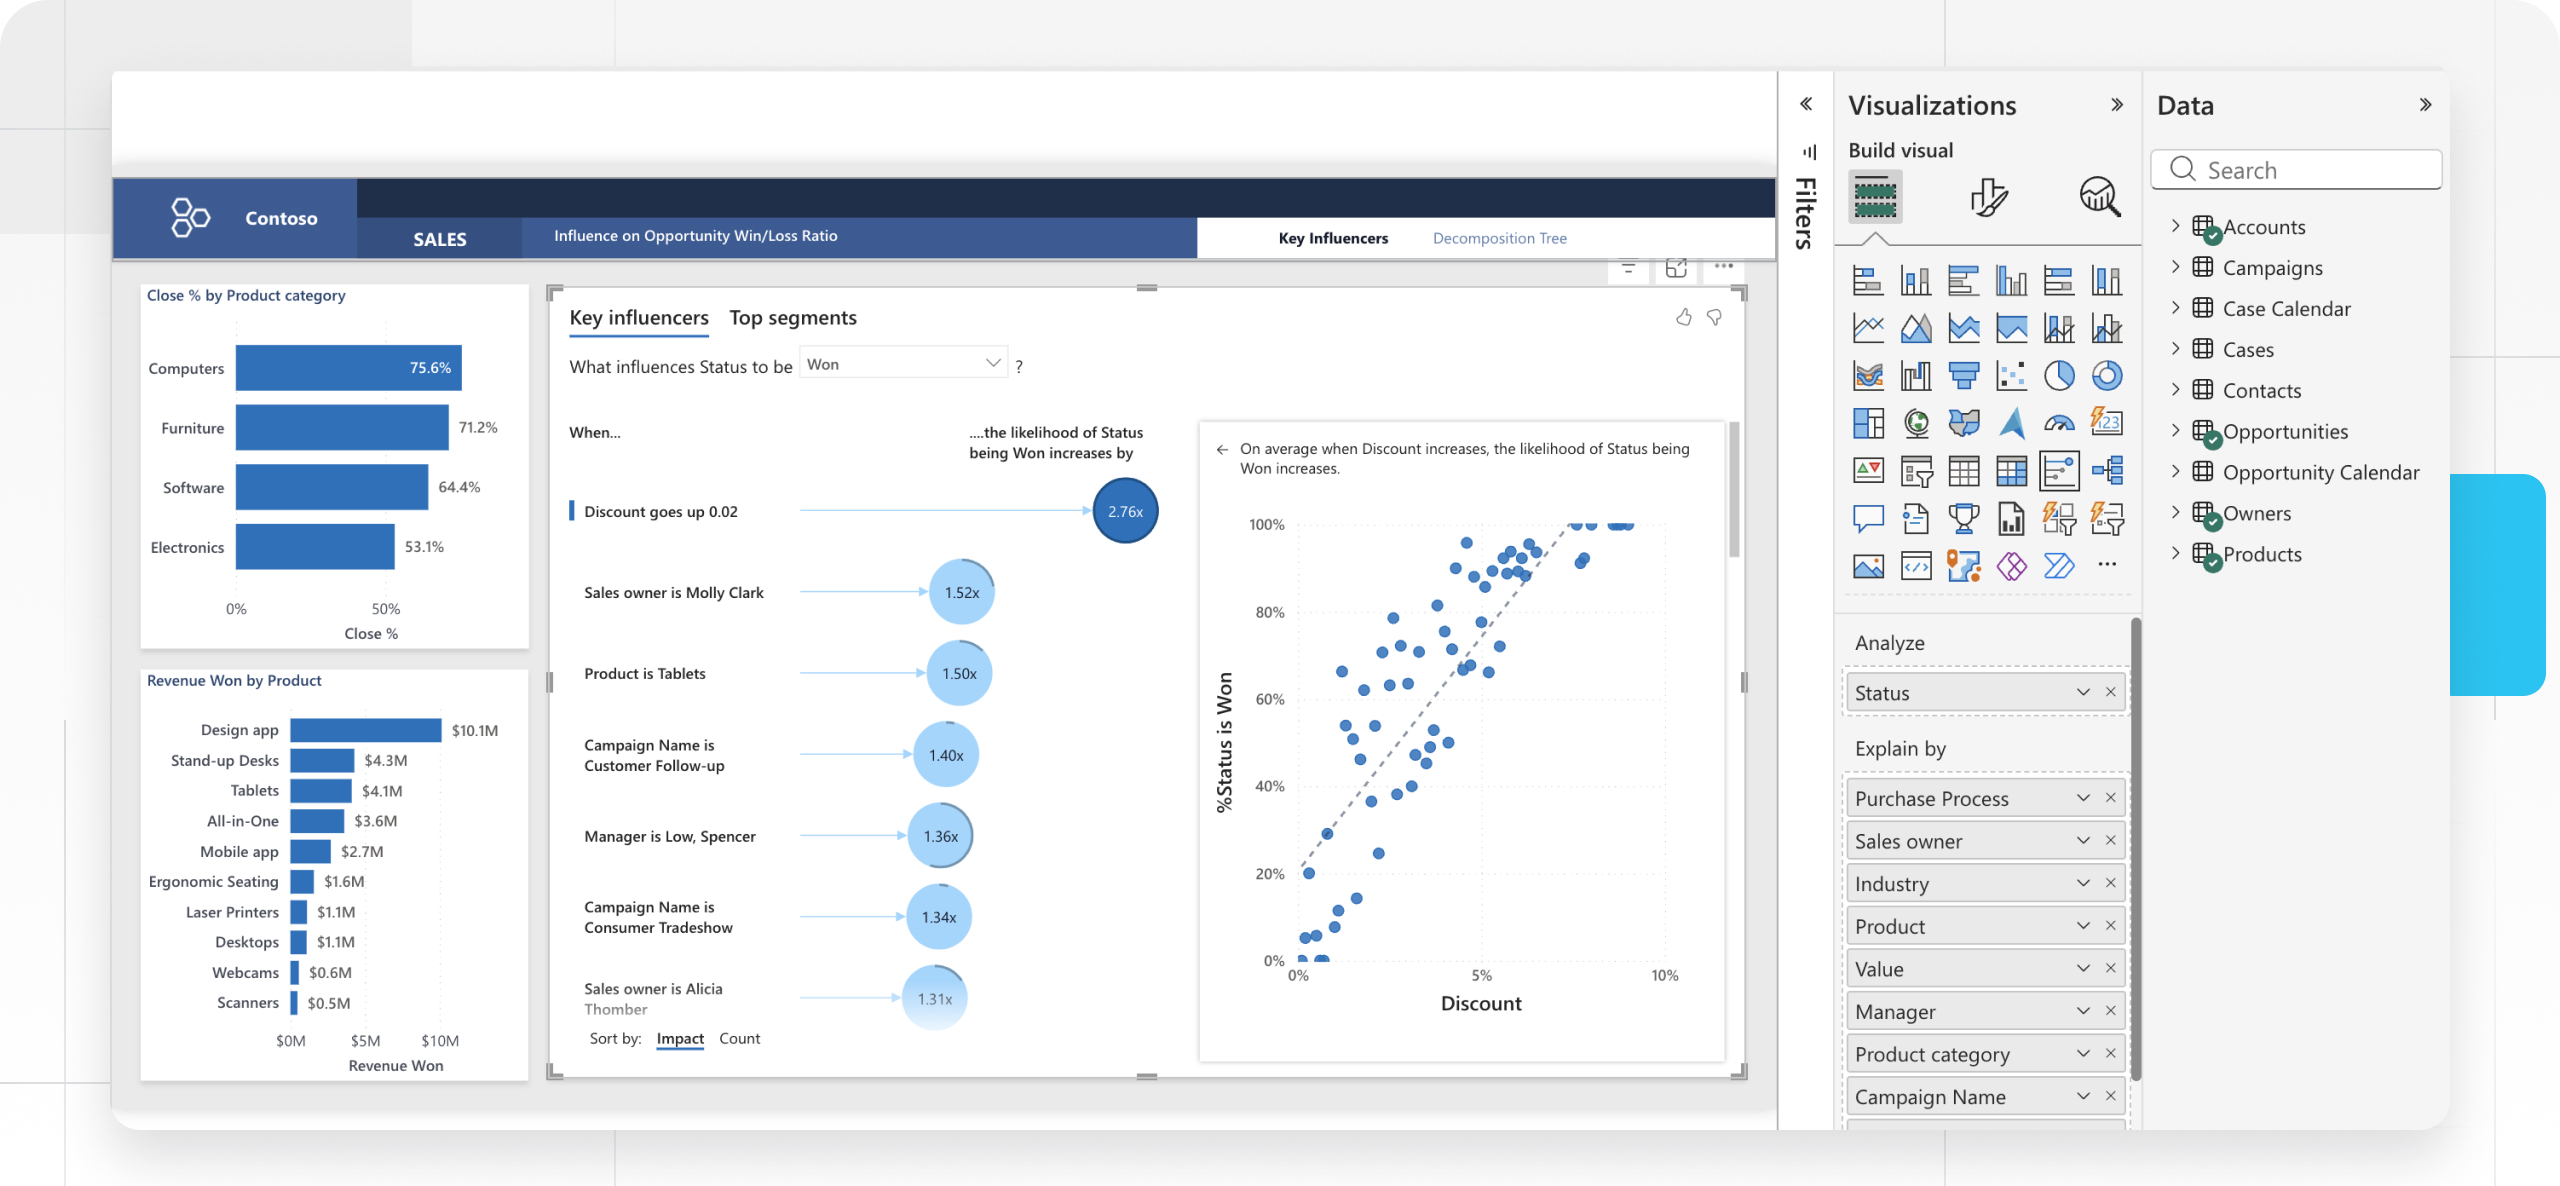
Step 5: Build the First Visual
- In the Power Query Editor, click Close & Apply.
- The Data pane on the right now lists the fields from Baserow.
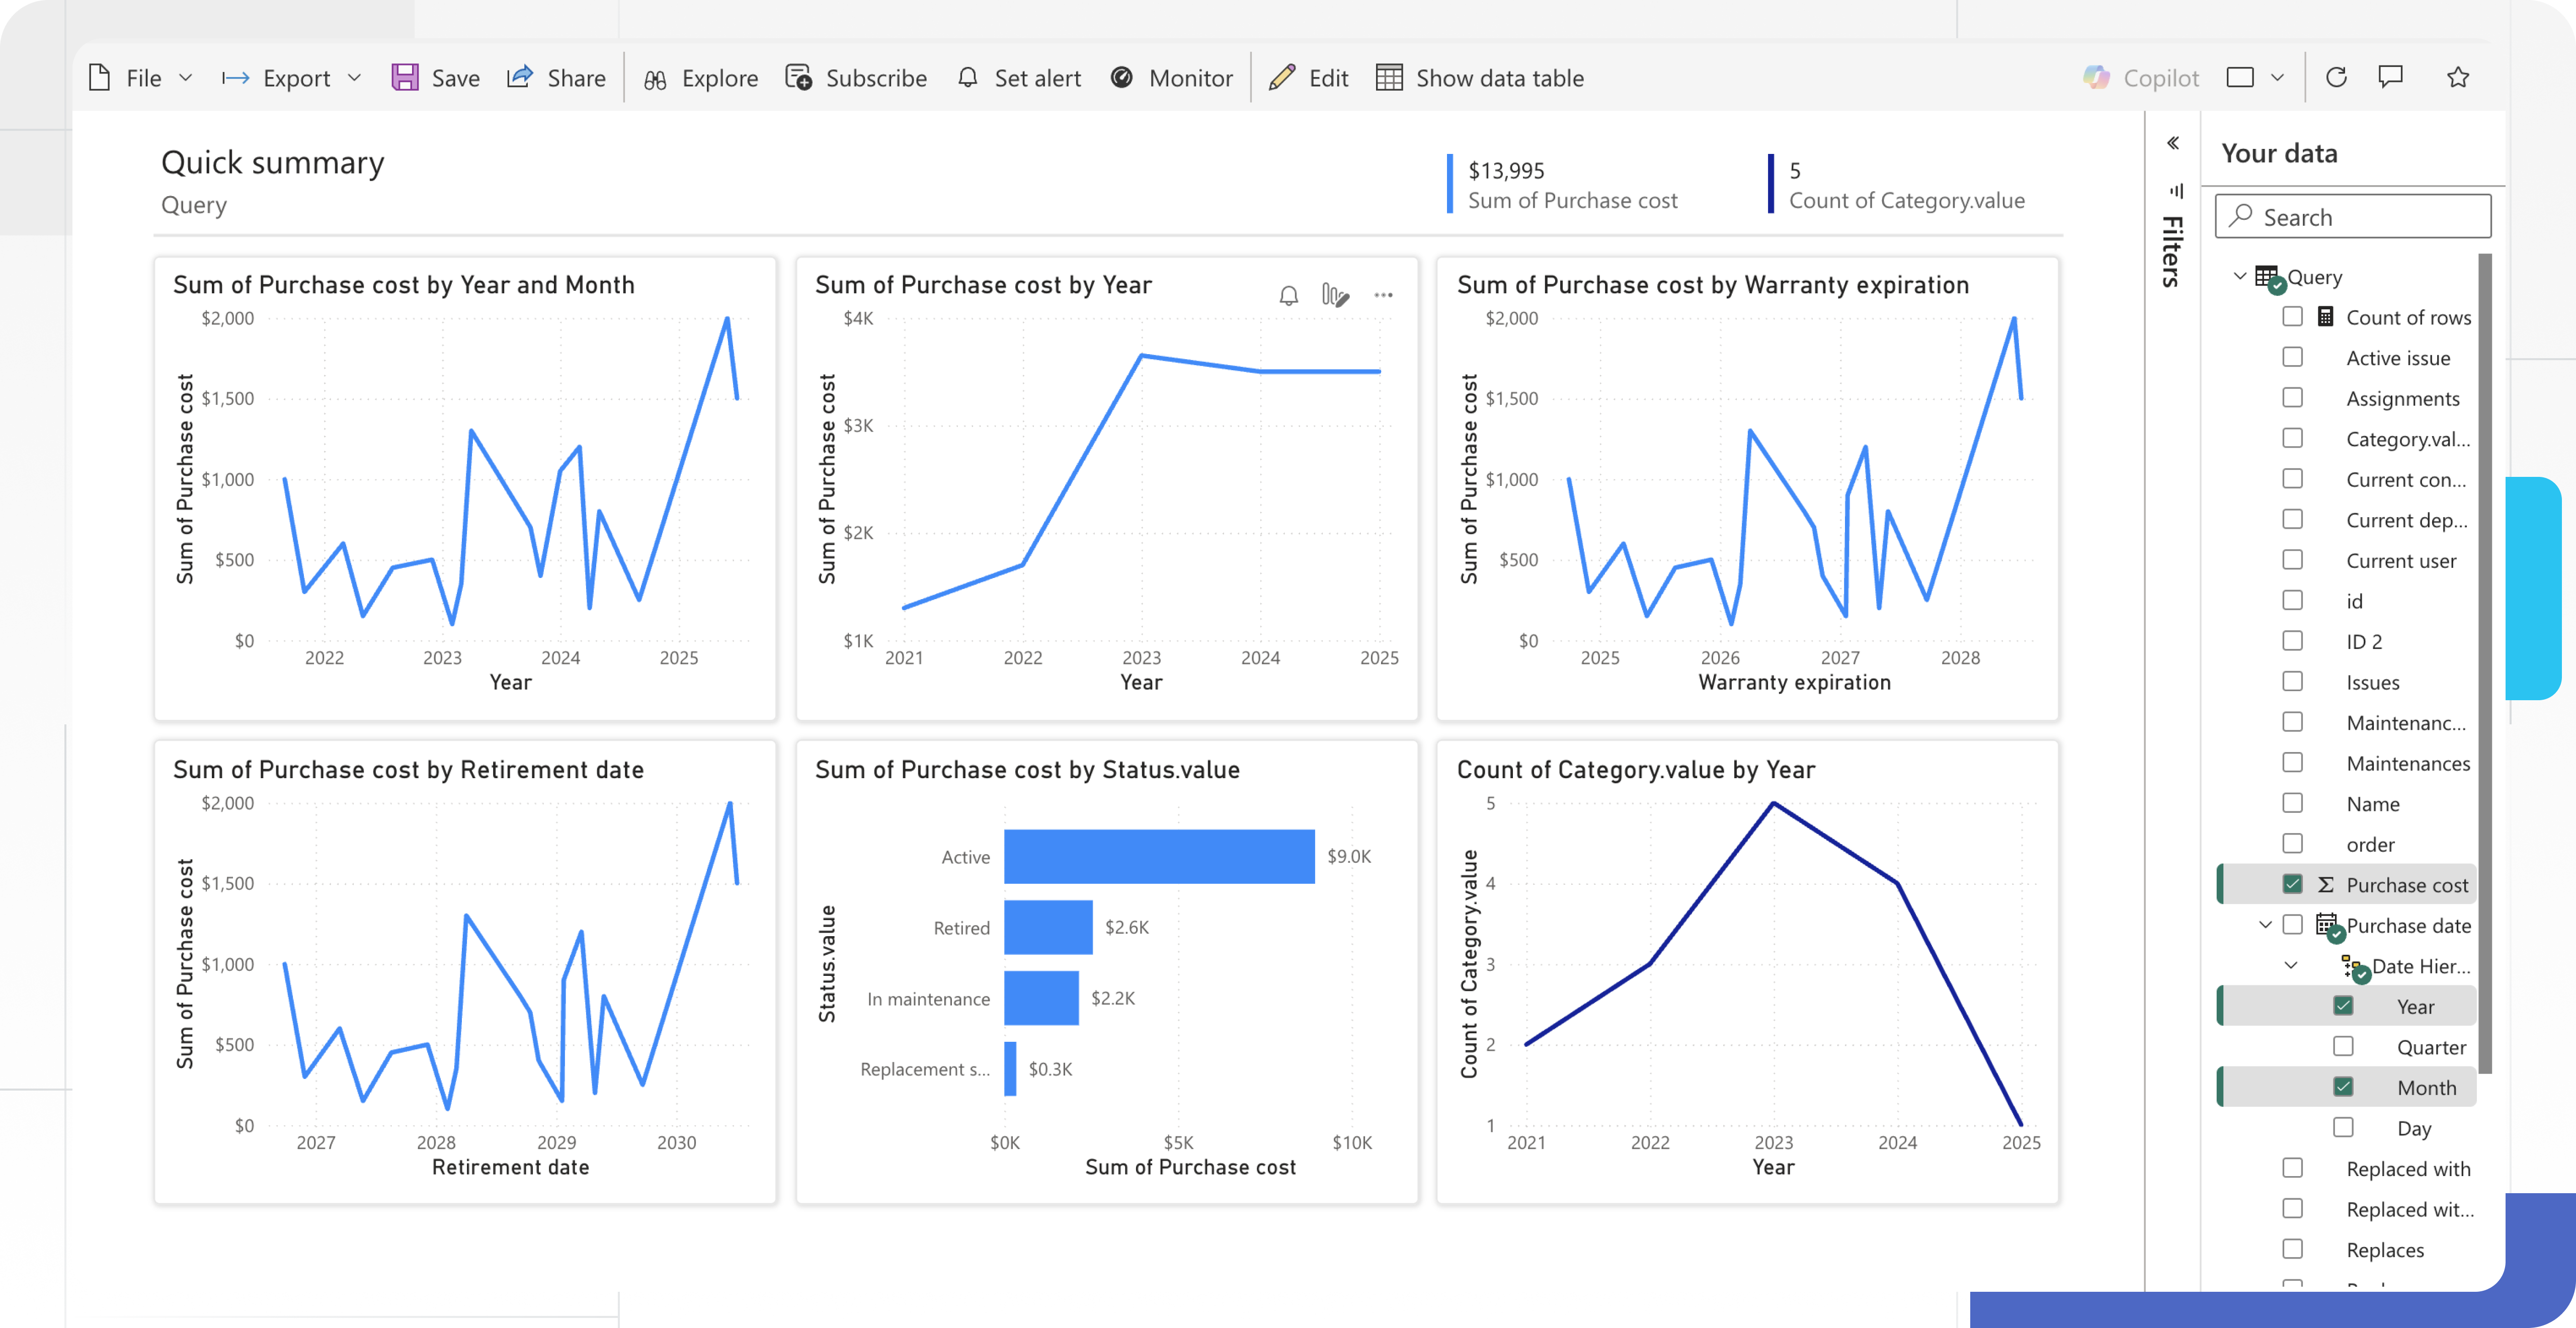
- Drag a field onto the report canvas - Power BI turns it into a chart right away.
- For a bar chart: drag the status field to the X-axis and an ID field to the Y-axis, aggregated as “Count.”
- Every click of Refresh pulls the current state of the data from Baserow into the visual.
Handling Pagination
Baserow returns a maximum of 200 rows per request. A 1,000-row table needs 5 requests - either fetched manually or automated.
Manual pagination works for smaller tables (under 1,000 rows) - simply raise the size parameter to its maximum:
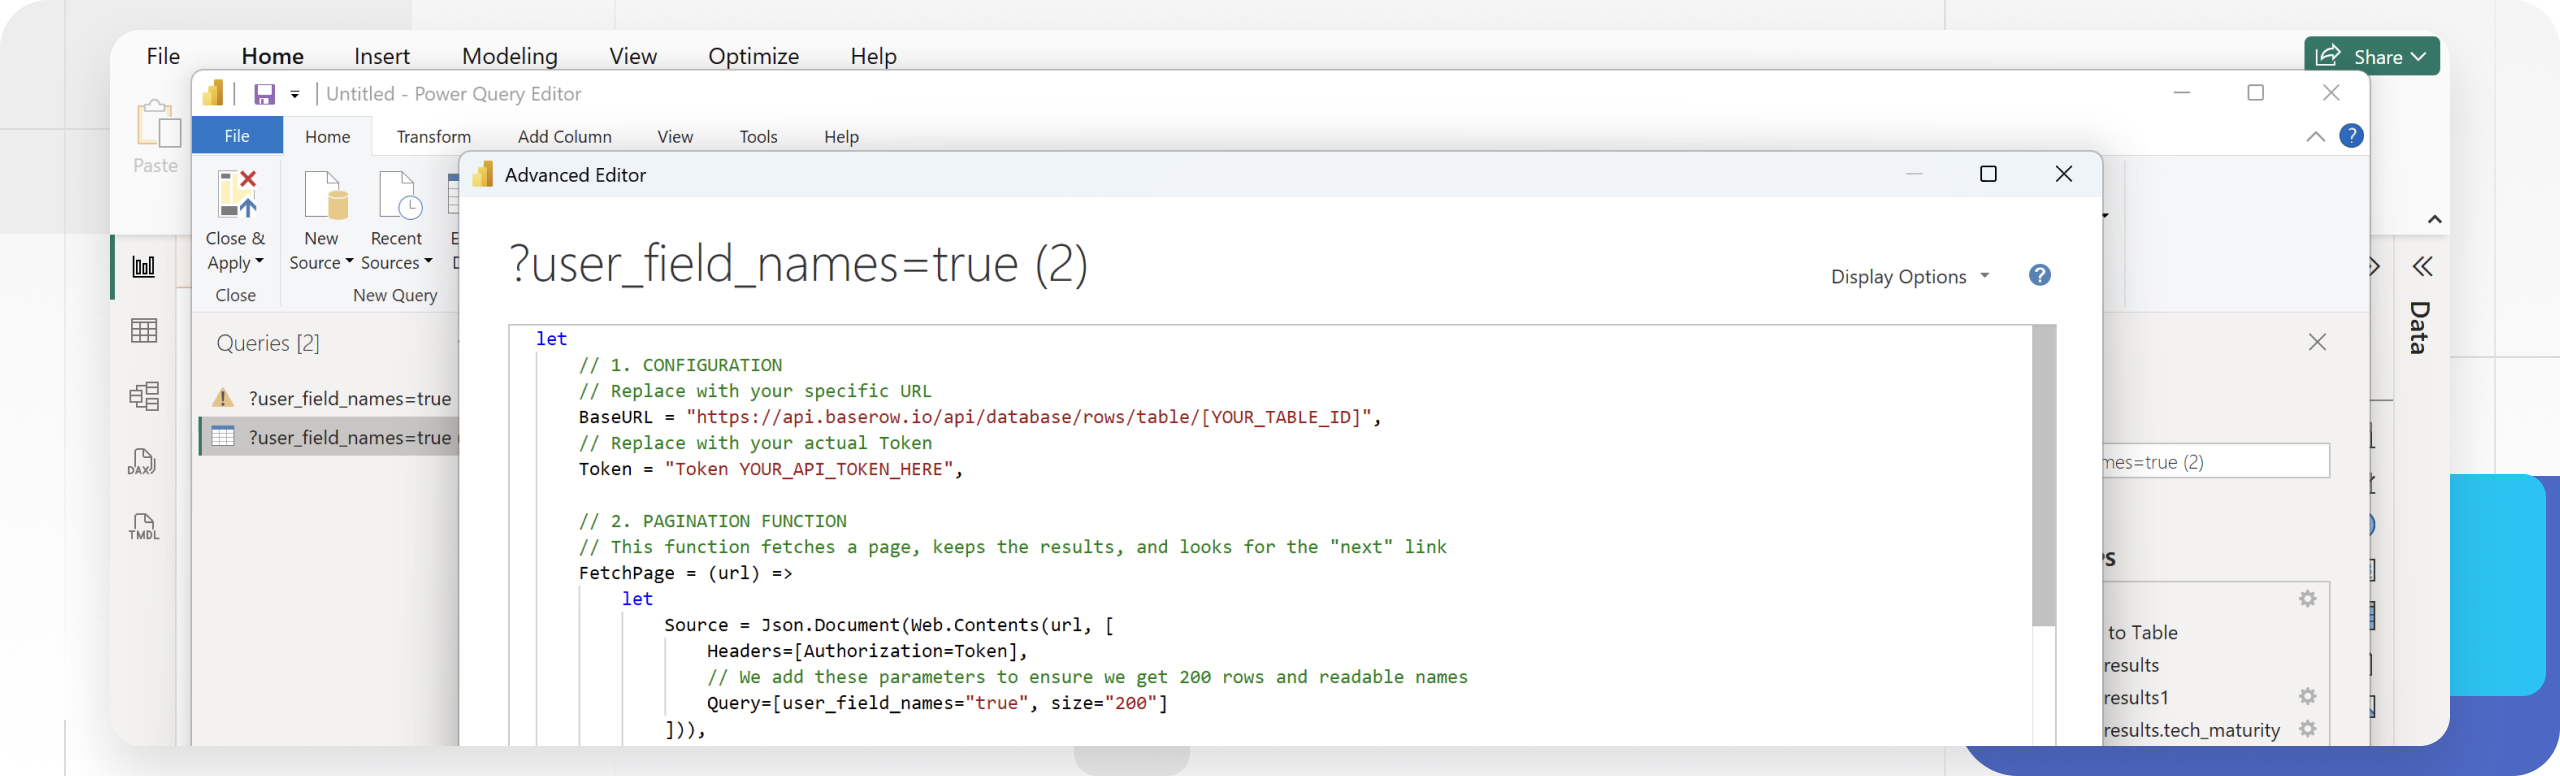
https://api.baserow.io/api/database/rows/table/12345/?user_field_names=true&size=200Automatic pagination is needed once a table exceeds a single page. In the Power Query Editor, open Home → Advanced Editor and replace the code with a recursive M script that follows the next link until it runs out:
let
    BaseUrl = "https://api.baserow.io/",
    RelativePathStart = "api/database/rows/table/[YOUR_TABLE_ID]/",
    Token = "Token [YOUR_API_TOKEN]",

    FetchPage = (relPath) =>
        let
            Source = Json.Document(Web.Contents(BaseUrl, [
                RelativePath = relPath,
                Headers = [Authorization=Token]
            ])),
            results = Source[results],
            nextURL = Source[next]
        in
            {results, nextURL},

    FetchAllPages = (relPath) =>
        let
            page = FetchPage(relPath),
            results = page{0},
            nextURL = page{1},
            newRelPath = if nextURL <> null then Text.Replace(nextURL, BaseUrl, "") else null,
            nextResults = if newRelPath <> null then @FetchAllPages(newRelPath) else {}
        in
            List.Combine({results, nextResults}),

    SourceList = FetchAllPages(RelativePathStart & "?user_field_names=true&size=200"),
    #"Converted to Table" = Table.FromList(SourceList, Splitter.SplitByNothing(), null, null, ExtraValues.Error),
    FieldNames = List.Distinct(List.Combine(List.Transform(SourceList, each Record.FieldNames(_)))),
    #"Expanded Column1" = Table.ExpandRecordColumn(#"Converted to Table", "Column1", FieldNames, FieldNames)
in
    #"Expanded Column1"
Replace [YOUR_TABLE_ID] and [YOUR_API_TOKEN] with the real values; for a self-hosted Baserow instance, update BaseUrl to point at that server too. After pasting this script, review every column’s data type by hand - since the script expands fields dynamically, it cannot guess the right type on its own.
Keeping Data in Sync: Manual vs. Scheduled Refresh
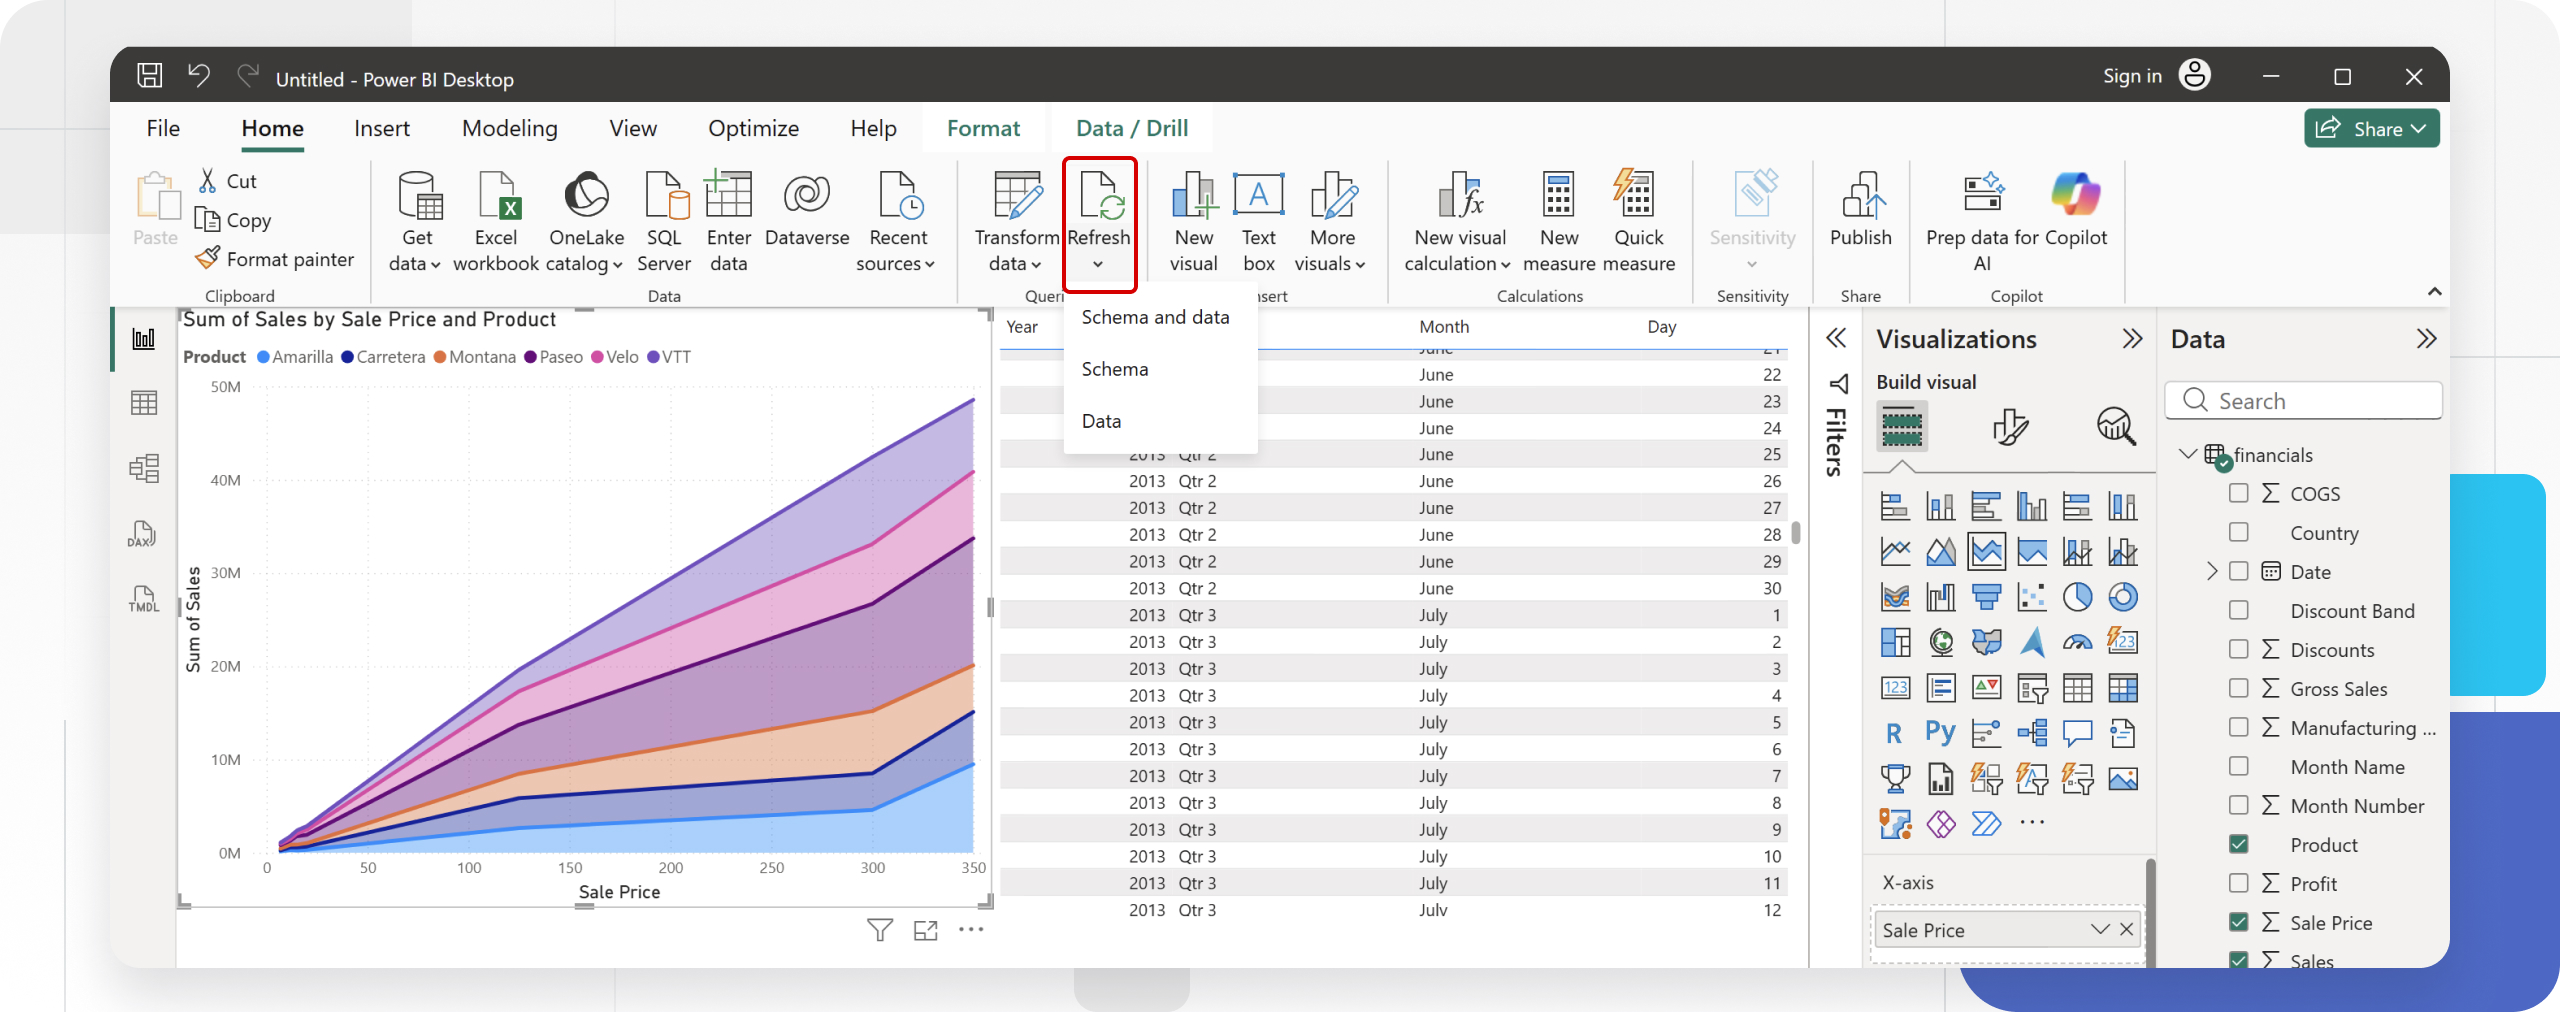
A row change in Baserow does not appear in Power BI instantly - a refresh has to run first:
- In Power BI Desktop - the Refresh button on the Home tab calls the API again and updates every visual.
- In the Power BI cloud service - a refresh schedule can be set (e.g. every morning at 9:00), but because the connection uses a token in a custom header, the service usually cannot refresh this kind of Web source without an On-Premises Data Gateway installed.
Query Folding and API-Level Filtering
Web connectors do not support query folding - every transformation runs locally inside Power BI rather than at the source. To avoid pulling unnecessary rows into the report, push filtering and sorting into the API request itself with URL parameters, such as filter__Status__equal=Active. See Filters in Baserow
for the filter syntax.
Baserow Field Types and Power BI Equivalents
| Baserow field type | Power BI data type | Note |
|---|---|---|
| Text | Text | Direct mapping |
| Long text | Text | Direct mapping |
| Number | Decimal Number / Whole Number | Pick based on the number of decimal places |
| Rating | Whole Number | Stars become integers (1-5) |
| Boolean | True/False | Direct mapping |
| Date | Date | ISO 8601 format (YYYY-MM-DD) |
| Last Modified | DateTime | Timestamp with time zone |
| Created On | DateTime | Timestamp with time zone |
| URL | Text | Stored as text; link is active in the visual |
| Text | Stored as text | |
| Phone Number | Text | Stored as text to preserve formatting |
| Single select | Text | Returns the selected option |
| Multiple select | Text (list) | Requires splitting in Power Query |
| File | Text (JSON) | Array of file objects with URLs |
| Link to table | Text (JSON) | Array of linked record IDs and values |
| Lookup | Text | Returns the looked-up value |
| Formula | Depends on the formula | Determined by the formula’s output type |
| Rollup | Number | Aggregated value from linked records |
| Count | Whole Number | Count of linked records |
| Autonumber | Whole Number | Sequential identifier |
Link to Table Fields: Two Ways to Handle Them
A link to table field returns a list of linked record IDs and values - Power BI cannot infer relationships between such tables automatically, they need to be built by hand in the data model.
Method 1 - best for simple reports. Expand the linked column directly in Power Query: first to new rows, then again to reach value. This produces one flat table, which works fine for smaller datasets.
Method 2 - best for reports with heavy relationships. Merging a link field in Power Query across tens of thousands of rows duplicates the same text value in every row. Instead of merging, load both tables separately, open the Model View, and manually connect one table’s ID column to the other’s. This model performs better and lets a single slicer filter multiple tables at once.
Field IDs Instead of Names for Production Reports
The user_field_names=true parameter is convenient during development, but if a field gets renamed in Baserow, the Power BI refresh fails immediately - it can no longer find a column with the old name.
For production reports, import using the raw field IDs (field_482) instead of readable names: rename the field_482 column in Power Query after the import, via right-click → Rename. A field’s ID never changes even if its name in Baserow does, so the report keeps working.
Troubleshooting
| Error code | Cause | Fix |
|---|---|---|
| 401 Unauthorized | Malformed token | Confirm the word “Token” plus a space appears before the token itself |
| 404 Not Found | Wrong URL | Check the table ID and confirm the API address was pasted, not the browser URL |
| Expression.Error | JSON parsing failure | A field being expanded contains null - add a “Remove Errors” step or use try/otherwise |
| Credentials Required | Missing gateway | Cloud refresh needs an On-Premises Data Gateway installed |
| “This dataset includes a dynamic data source” | The URL is built dynamically inside a loop | Use the RelativePath pattern in the M code - it tells Power BI the base address is static, so cloud refresh is allowed |
Frequently Asked Questions
Does this integration require a paid Baserow plan? No - the connection runs on the free REST API and a database token, both available in the open-source edition of Baserow without limits.
Can Power BI write data back into Baserow? The Web connector is built for reading data. Writing rows back through the API is technically possible with separate requests, but it falls outside this integration’s standard flow.
What if a table has more than 200 rows? Use the automatic pagination M script covered above - it follows the next link on its own until every page has been fetched.
Next, read Baserow Notion Integration to see the same REST API used to sync records between the two tools.