How to Group Rows in Baserow by Field Value - Guide
Grouping turns a flat table into an organized hierarchy, automatically sorting rows by status, department, priority, or any field to surface patterns hidden in a long list of records. This article explains how to organize table data by grouping rows on field value, building collapsible sections that make navigation and analysis easier.
Overview
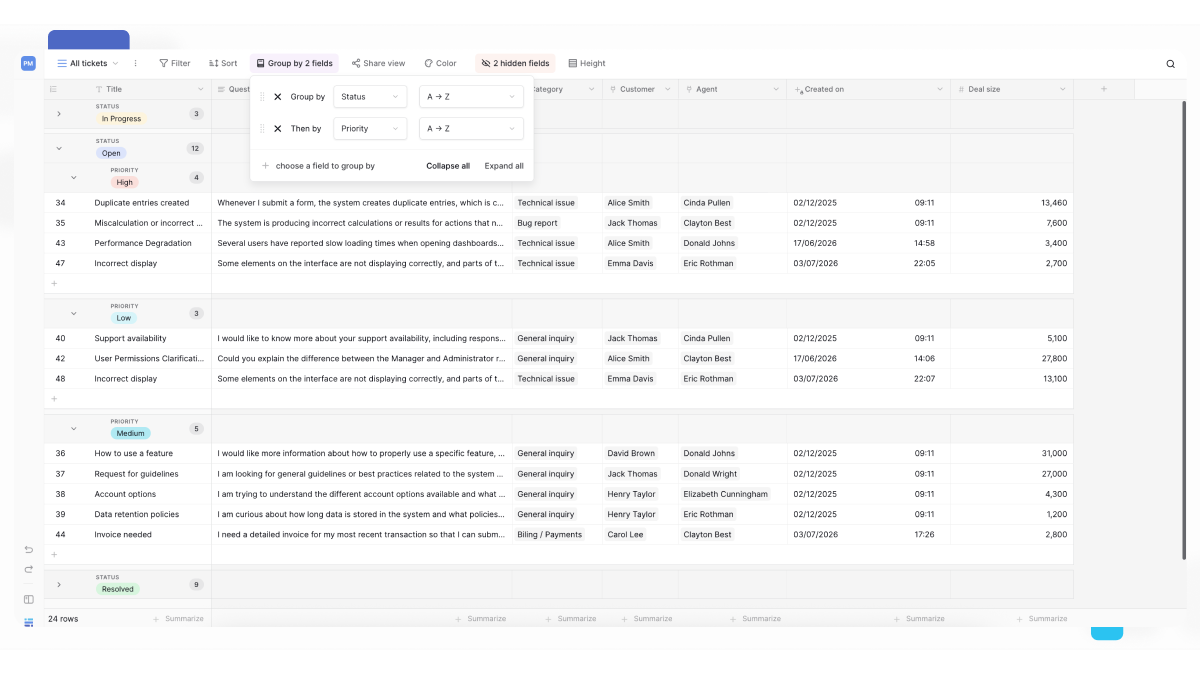
The group-by feature organizes table rows into expandable and collapsible groups based on one or more field values, making large datasets easier to navigate and analyze. Group tasks by Status, by Assignee, or by both at once to build nested groups that keep related rows together. Each group can display a summary such as a count or a sum, new rows can be created directly inside a group, and groups can be reordered by dragging. You can group by up to five fields, organizing data across several levels without losing context.
Groups update automatically as data changes. Add a row with a new status value and Baserow creates a new group for it instantly. Nest several levels of grouping to build a hierarchy like Department → Team → Priority, surfacing patterns across multiple dimensions at once.
Grouping works only in grid view and complements filtering and sorting, giving you powerful data organization without formulas or complex settings.
When to use row grouping
Project management. Group tasks by Status to see what’s In Progress, Blocked, or Complete. Add a second-level grouping by Assignee to see each person’s status breakdown.
Sales pipeline. Group opportunities by Stage (Prospecting, Negotiation, Closed) to visualize the pipeline. Nest by Sales Rep to see each team member’s slice of it.
Inventory management. Group products by Category, then by Supplier, to understand the inventory structure and supplier relationships.
Event planning. Group registrations by Event Date, then by Ticket Type, to see attendance patterns and revenue distribution.
Customer support. Group tickets by Priority, then by Department, to see workload distribution and urgent items that need attention.
Grouping vs. filtering vs. sorting
| Feature | Purpose | Result | Row visibility |
|---|---|---|---|
| Grouping | Organize into categories | Collapsible groups with summaries and nesting | Every row organized into a group |
| Filtering | Show a subset of data | Hide rows that don’t match | Only matching rows are visible |
| Sorting | Change row order | Rows arranged by value | Every row visible, in order |
| Combined | Focus and organize | Filtered data in organized groups | Only matching rows, grouped |
Field types compatible with grouping
| Field type | Groups by | Example grouping |
|---|---|---|
| Single select | Each option | Status: To Do, In Progress, Done |
| Multiple select | Each selected option (a row may appear in several groups) | Tags: Marketing, Sales, Product |
| Collaborator | Each person | Assigned to: Alice, Bob, Charlie |
| Link to table | Each linked record | Customer: Acme Corp, TechCo, and so on |
| Boolean | Checked / Unchecked | Completed: Yes, No |
| Date, Duration, Last modified, and Created on | Date value | Due date: 2026-01-15, 2026-01-20, and so on |
| Text, URL, and Email | Exact text match | Department: Engineering, Sales, Support |
| Number, Count, Phone number, and Rating | Exact number value | Priority: 1, 2, 3 |
Formula, lookup, and other computed fields can be used for grouping based on their result type.
How to add a group
Create your first grouping level to organize rows by a single field. You can group by up to five fields, nesting groups within groups.
To group rows:
- Open the table in grid view.
- Click the Group button in the view toolbar.
- Select Choose a field to group by from the dropdown.
- Pick the field you want to group by.
Rows immediately reorganize into collapsible sections based on the field’s unique values. Each section header shows the value name and its row count.
How to add multiple group levels
Build nested groups (subgroups) to surface hierarchical patterns in the data.
To add a second grouping level:
- After creating the first group, click Choose a field to group by again.
- Select a second field from the dropdown.
- Rows inside each first-level group now split into second-level subgroups.
Example: group by Department (first level), then by Priority (second level), to see each department’s priority breakdown.
To add more levels, repeat the process - each new level creates subgroups inside the previous level’s sections.
How to manage groups
Expand and collapse groups
Groups are collapsed by default, which makes navigating a large dataset easier.
You can:
- expand a single group to see its rows;
- collapse a group to hide its contents;
- expand or collapse nested groups independently;
- use “Expand all” or “Collapse all” to change every group’s visibility at once.
Collapsed groups display their row count and any configured summary, which makes navigating a large table easier.
Reorder group levels
Reorder the group-by fields by dragging them.
The order of grouping levels sets the hierarchy: the first field creates the top-level groups, and each additional field creates a nested subgroup.
For example:
- Status → Assignee groups tasks by status first, then by assignee;
- Assignee → Status groups tasks by assignee first, then by status.
Remove a group level
Click the X button next to any group in the group panel to remove that level. Removing a middle level shifts the levels below it up the hierarchy.
Change a group’s field
Click a group field in the panel and pick a different field from the dropdown to replace it. The view regroups instantly using the new field.
The top field always sets the primary grouping, with each subsequent field creating a nested subgroup.
Clear all groups
Remove every grouping level by clicking the X on each group, or close the group panel. The table returns to a flat list.
Group summaries and counts
Each group header shows the number of rows it contains. You can also configure field summaries calculated separately for every group.
Besides row counts, the same calculations available in the table footer can be shown, calculated separately per group. Depending on the field type, the available summaries include:
- count;
- empty / not empty;
- sum;
- average;
- minimum;
- maximum;
- median;
- standard deviation;
- variance;
- unique values.
Group summaries update automatically whenever rows are added, edited, or deleted.
Combining grouping with filters and sorts
Grouping works alongside filtering and sorting to build powerful data views:
Grouping + filtering. Apply filters first to show a subset of rows, then group the filtered results. Example: filter to show only “Open” tickets, then group by Priority.
Grouping + sorting. Sort rows within each group alphabetically, numerically, or by date. Groups keep their structure while the rows inside sort independently.
Grouping + both. Build a focused, organized view: filter out unwanted rows, group the results into categories, and sort within each group. Example: show this quarter’s sales (filter) → grouped by Region → sorted by Deal Value descending.
How grouping affects multiple select fields
Multiple select fields behave differently when grouped, because a row can have several values selected at once.
Group by a multiple select field, and a row appears in every group matching its selected values. A task tagged with both “Marketing” and “Sales” shows up in the Marketing group and the Sales group.
That differs from single select grouping, where each row lands in exactly one group. Be aware that group row counts can exceed the table’s total row count when grouping by a multiple select field.
Frequently asked questions
Can I group by formula or lookup fields? Yes, you can group by any field type, including formulas and lookups, as long as the field produces a groupable value. Grouping uses the calculated or looked-up result to build the groups.
What happens to rows with empty values when grouping? Rows with an empty value in the grouped field land in a separate “(Empty)” group at the top or bottom of the view, making it easy to spot records with missing values in an important field.
Does grouping affect my data, or just the view? Grouping only changes how you view the data - it never changes the data itself. Remove every group and the table’s underlying structure stays intact. Each view can carry its own grouping configuration.
Does grouping slow down a table? Grouping adds minimal performance impact for most tables. Very large tables (100,000+ rows) with several grouping levels might render a little slower, but Baserow’s lazy loading keeps scrolling and interaction smooth.
Can I export grouped data with its group structure? Exporting a view produces flat data without the group structure. Rows do appear in the order they were displayed within groups, though, so the grouping sequence is still visible in the exported file.
How many fields can I group by? Up to five, building nested groups that help organize data across multiple levels.
Related content
- Grid view guide - grid view’s features in full;
- Filters in Baserow - combine filtering with grouping for a focused view;
- View customization - every other view configuration option;
- Footer aggregation in Baserow - calculations for grouped data;
- Create custom views of your data - design a view around a specific grouping need.